Improve your Github Pages-ClustrMaps
Published:
In this post, we talk about how to use ClustrMaps to decorate your github pages.
ClustrMaps is a website that can track your website visitors from all over the world and visualize it using a real-time map. It is super easy to use and very informative if you are curious about who your visitors are. See this site for an example of using ClustrMaps.
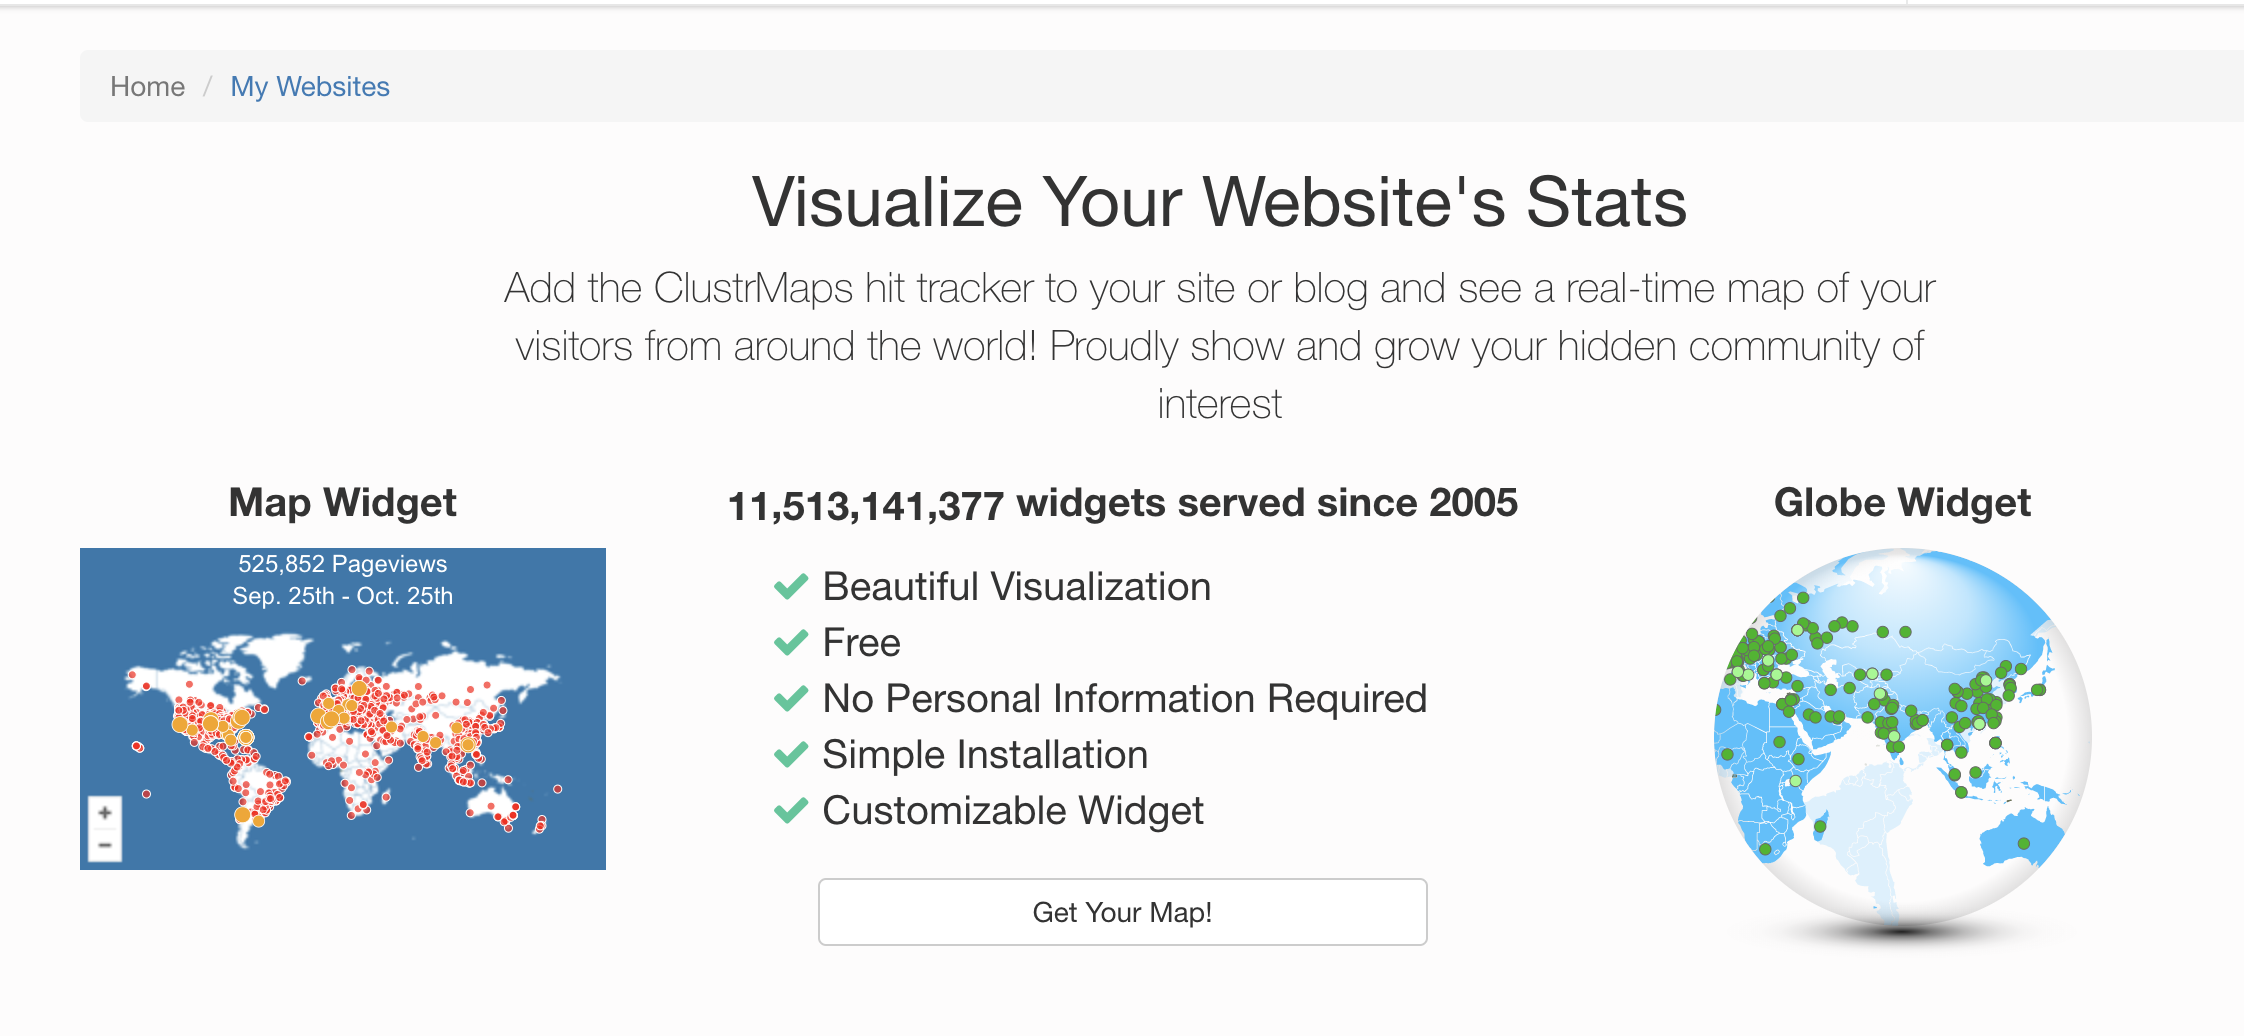
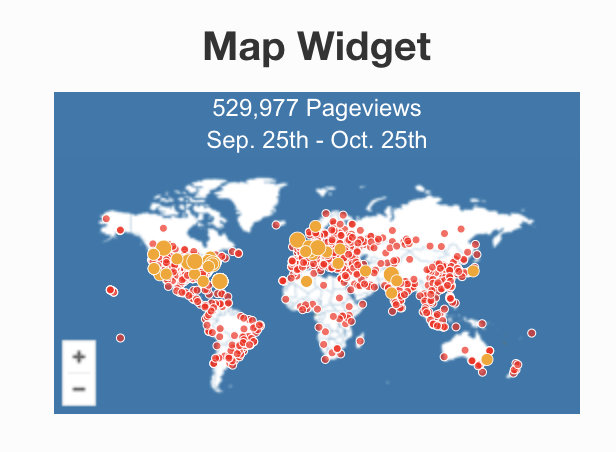
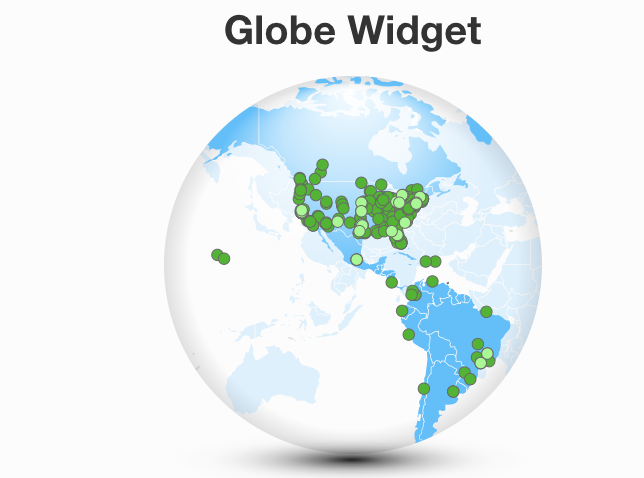
After typing in your website, you can choose whether you want a globe widget or a map widget. A globe widget is more active as it spins constantly while the map widget is only a static image. However, you are able to customize the size/color/pageview text of map widgets, but not for globe widgets. I personally prefer map widgets due to the useful customization.
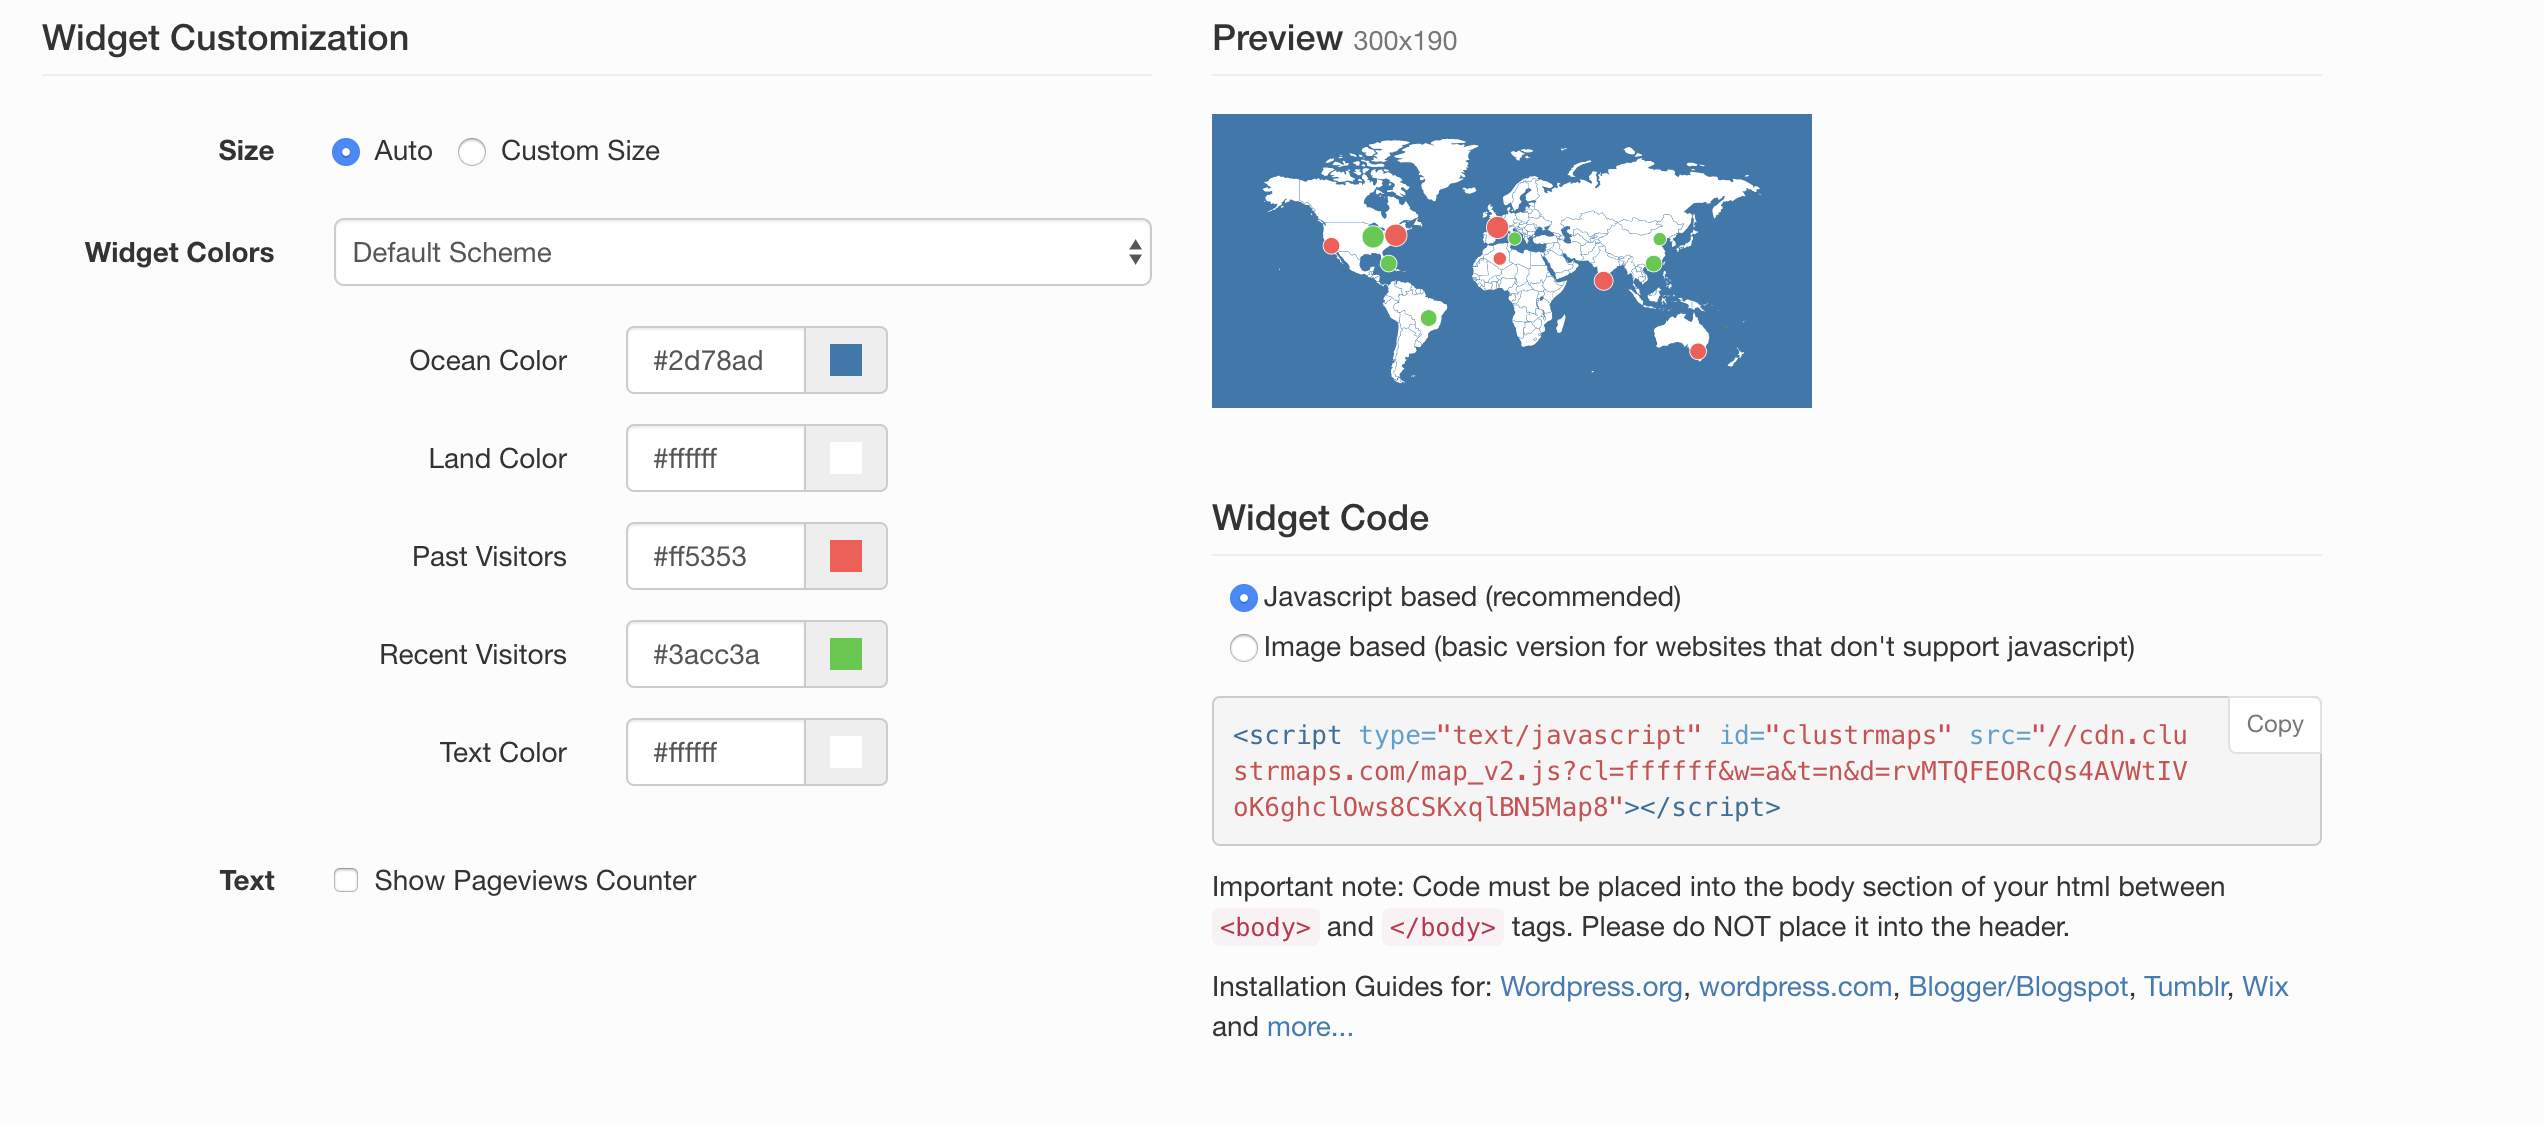
Here we use map widget as an example, go to the preview page and we can see a few lines of code on the left-hand-side. If you don't want customization and are satisfied with how it looks right now, you can directly copy the code into your markdown/html file of your website (e.g. about.md, cv.md, teaching.html). Wait for a few seconds and then your cluster map is ready to use. 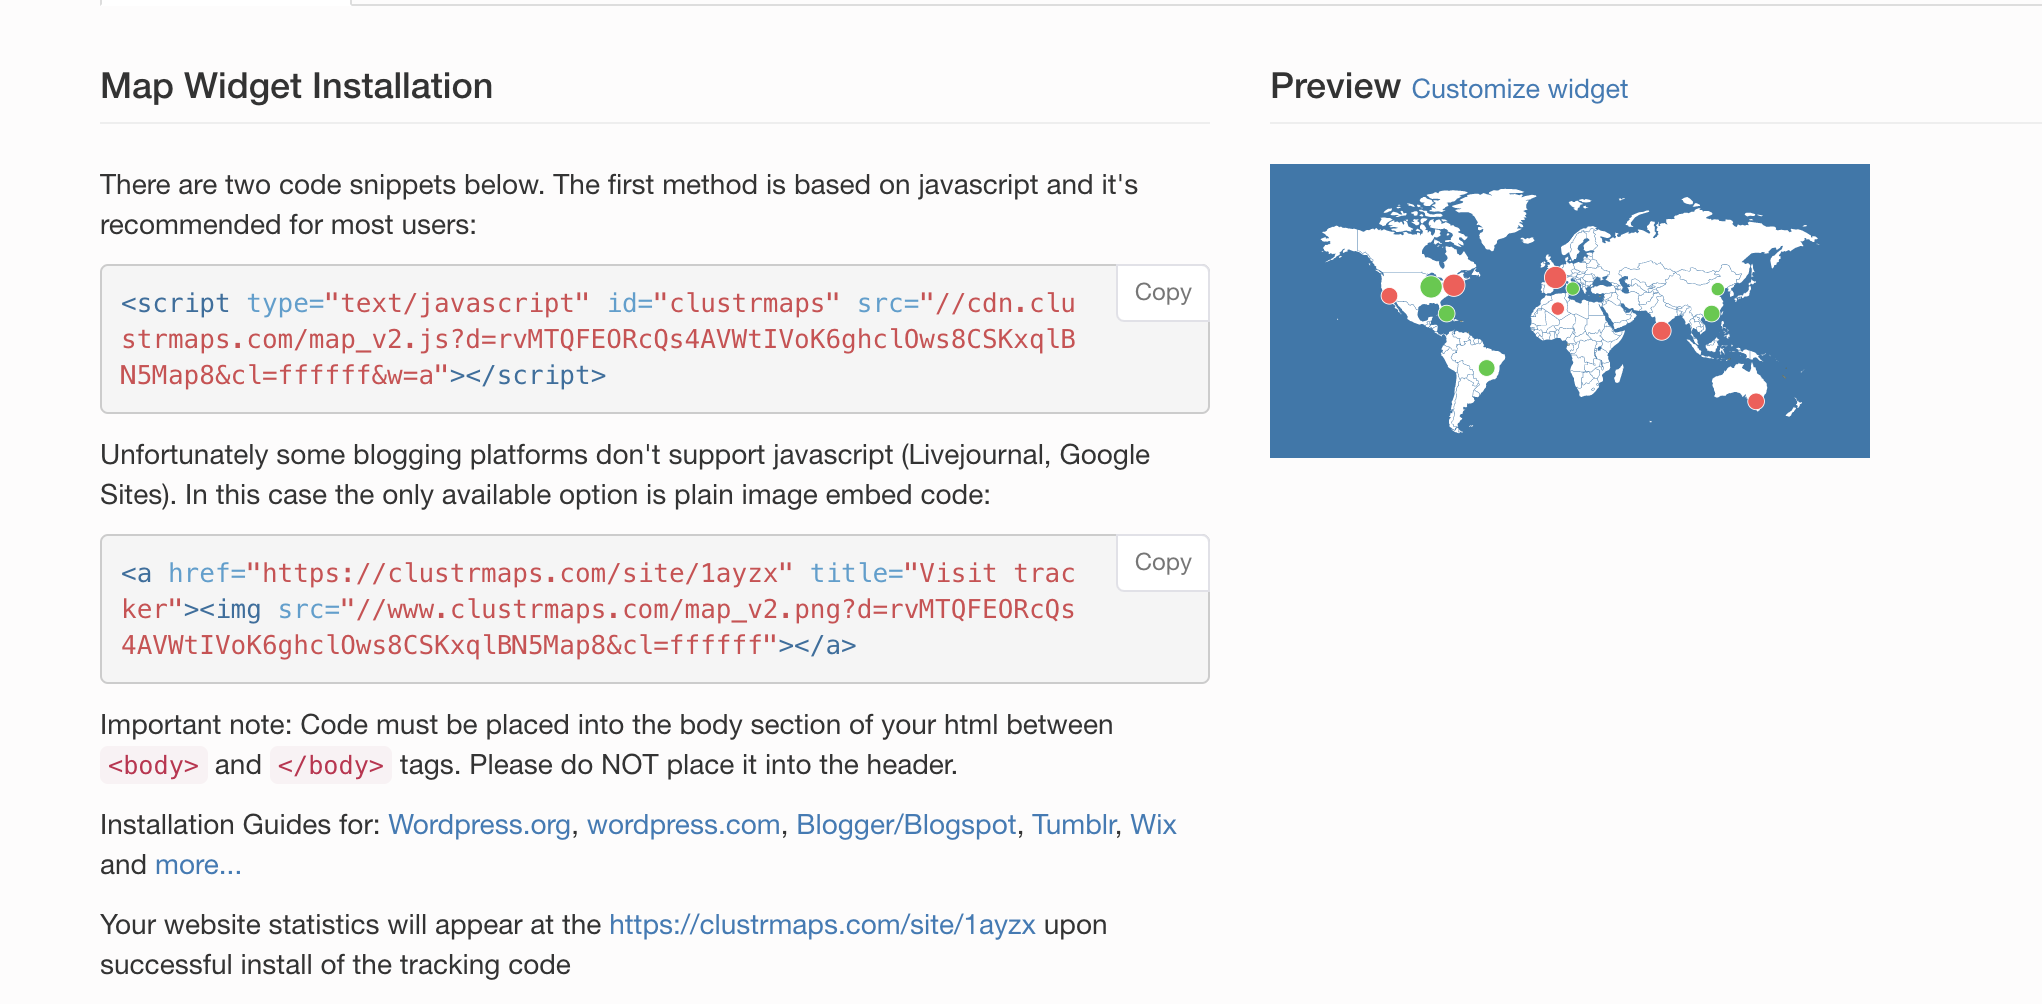 If you don't think the map widget is good enough, come back to the preview page and click on "Customize widget". In this page, you are able to customize the size, the font colors, the map colors, and the vistor counter. After setting all the parameters, you can then copy the code into your file and view your map in your website.